
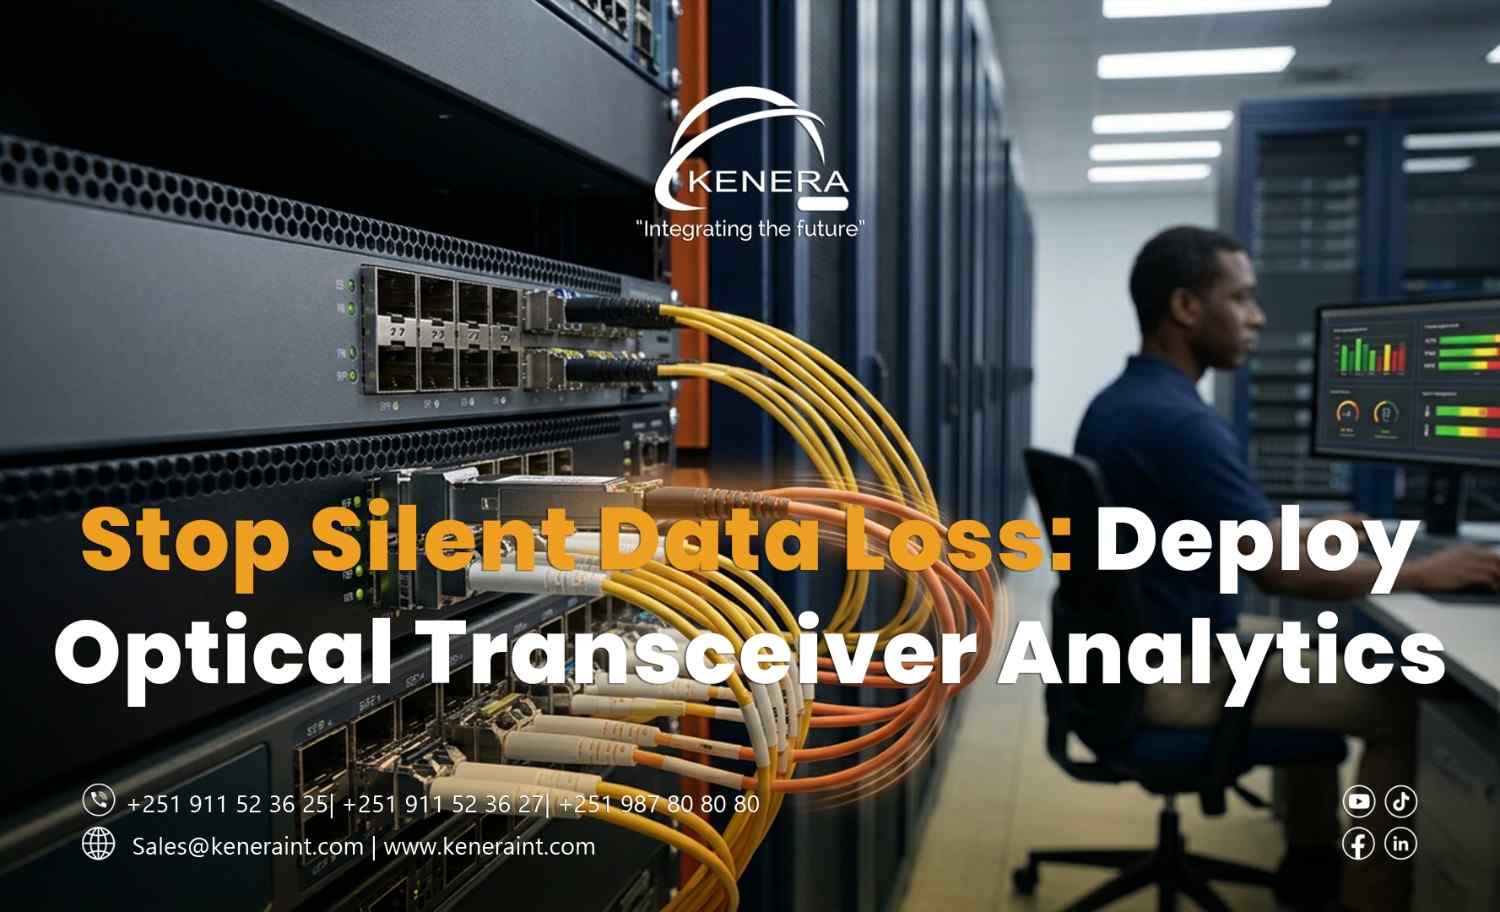
Stop Silent Data Loss: Deploy Optical Transceiver Analytics
Your network monitoring dashboard shows every fiber connection as operational.
The core switches are online. No ports are down. The data center appears healthy.
Yet employees complain about slow applications, intermittent connectivity, and unusually long file transfers.
The IT team checks bandwidth utilization. Nothing seems overloaded.
Then an engineer examines the optical transceiver diagnostics.
One fiber link is receiving significantly less optical power than expected, while interface error counters are steadily increasing.
The connection never went down.
It was degrading while everyone assumed it was healthy.
This is why optical transceiver monitoring deserves a place in every enterprise network reliability strategy.
1. A Green Link Light Does Not Mean a Healthy Fiber Connection
Fiber-optic connections can experience performance problems before failing completely.
Contaminated connectors, damaged patch cords, excessive bending, unsuitable optical modules, and aging components can affect signal quality.
Some problems cause intermittent errors rather than immediate link failure.
Depending on the interface and protocol, these errors may lead to discarded frames, retransmissions, application delays, or temporary connectivity problems.
Traditional monitoring that checks only whether an interface is up or down may miss these early warning signs.
Optical transceiver analytics helps engineers identify abnormal operating conditions before they develop into more serious failures.
2. What Optical Transceiver Analytics Actually Measures
Many enterprise optical modules support Digital Diagnostic Monitoring (DDM), also called Digital Optical Monitoring (DOM).
Depending on the module, these diagnostics may report:
Transmit optical power (Tx): The optical signal power being transmitted.
Receive optical power (Rx): The optical power reaching the receiver.
Module temperature: The operating temperature of the transceiver.
Supply voltage: The electrical voltage supplied to the module.
Laser bias current: The current used to drive the optical transmitter.
These measurements help engineers evaluate transceiver operating conditions.
However, not every optical module supports the same diagnostics, and readings must be interpreted against the manufacturer's specifications.
A low received-power reading alone does not identify the exact cause of a problem.
3. Why Optical Power Trends Matter More Than One Reading
Imagine a fiber uplink operating with stable received optical power for several months.
Over time, the received signal gradually weakens.
The connection remains active, but the trend suggests that the available optical margin may be decreasing.
If engineers monitor historical measurements, they may identify the change before the receiver approaches its supported sensitivity limits.
This provides an opportunity to investigate connectors, patch panels, fiber routes, or transceiver conditions during planned maintenance.
But optical power trends should not be evaluated in isolation.
Interface error counters, link events, equipment alarms, and application performance provide additional context.
The strongest diagnosis comes from correlating optical measurements with actual network behavior.
4. Five Steps to Deploy Effective Optical Monitoring
Enable supported transceiver diagnostics. Confirm that network switches and optical modules provide accessible DOM or DDM readings.
Establish normal operating baselines. Record expected optical power, temperature, and other supported measurements when links are functioning correctly.
Configure meaningful alert thresholds. Use vendor specifications and validated operational limits rather than applying identical thresholds to every module.
Monitor interface errors. Correlate optical diagnostics with CRC/FCS errors, discards, link flaps, and other relevant interface counters.
Investigate abnormal trends. Follow approved fiber inspection, cleaning, testing, and replacement procedures when measurements indicate possible degradation.
Centralized network monitoring platforms can help collect these measurements across multiple switches and locations.
5. Optical Analytics Cannot Replace Fiber Testing
Digital optical diagnostics are valuable, but they have limitations.
A transceiver reports conditions at its own interfaces. It does not provide a complete picture of every splice, connector, or fiber segment along the path.
When troubleshooting complex fiber problems, engineers may still need optical power meters, light sources, or optical time-domain reflectometers (OTDRs).
These tools can help evaluate insertion loss, identify physical faults, and locate certain types of fiber impairment.
Similarly, transceiver analytics cannot independently prove that application data has been permanently lost.
Modern network protocols may detect corrupted frames and recover through retransmission, although this can still affect performance.
The goal is to detect physical-layer degradation before it causes unacceptable errors or outages.
6. Make Optical Health Part of Network Operations
Enterprise networks increasingly depend on high-speed fiber connections between core switches, distribution layers, server racks, and data center facilities.
As link speeds and infrastructure complexity increase, proactive optical monitoring becomes more valuable.
IT teams should include transceiver diagnostics in routine health checks, capacity reviews, incident investigations, and preventive maintenance programs.
Kenera International supports organizations in designing and deploying enterprise networking and fiber-optic infrastructure with attention to performance, monitoring, scalability, and operational reliability.
Because waiting for a fiber link to fail completely is not a monitoring strategy.